I am learning how to do data science. This is built using a Quarto Website. This is a powerful tool in data science. It enables me to easily display code and output at my discretion. Below is an example of this in action.
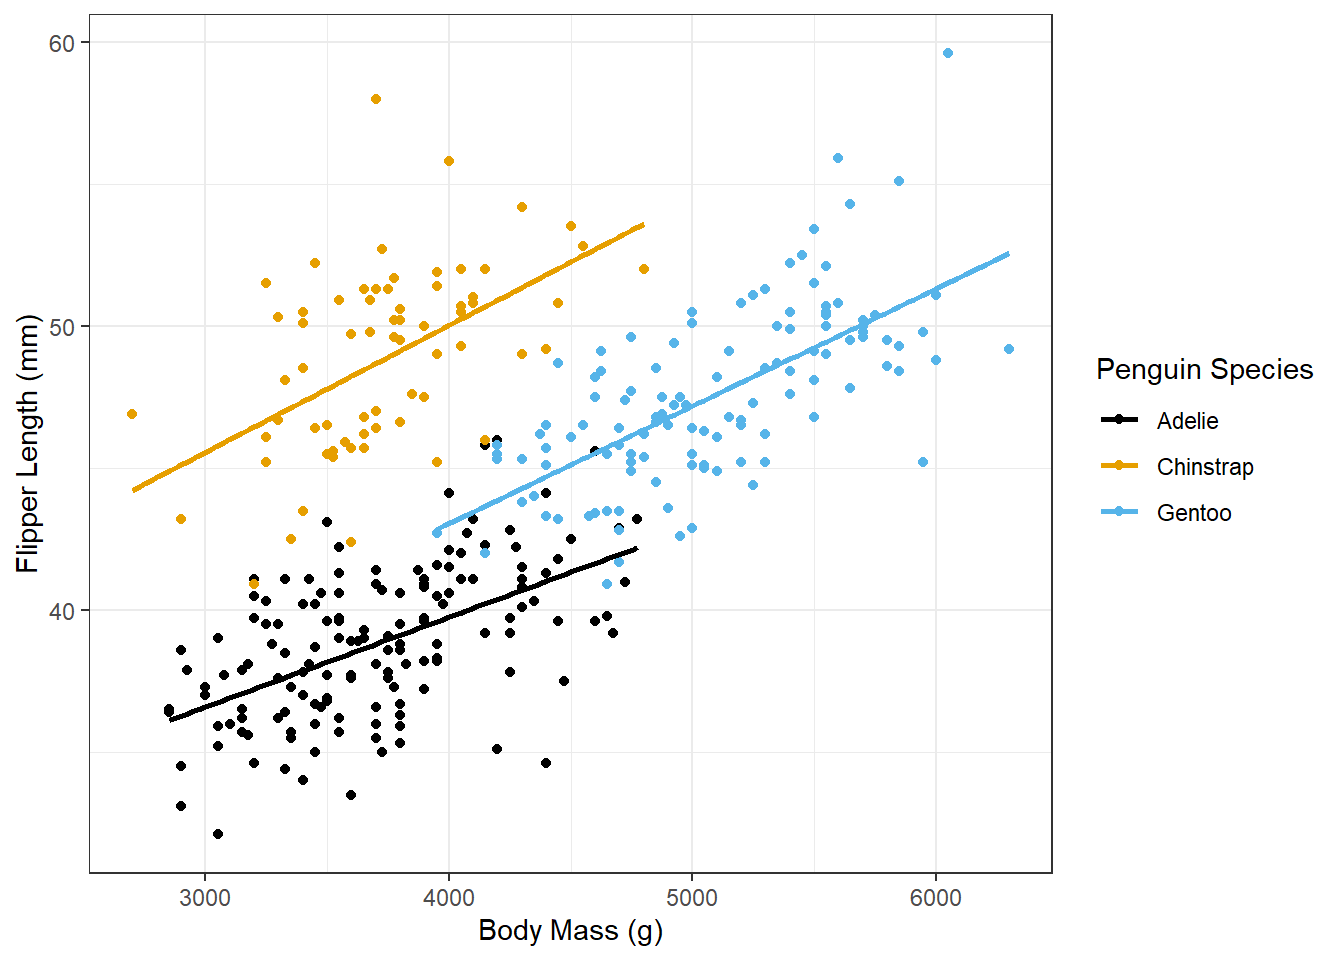
penguins %>%drop_na() %>%ggplot(aes(x = body_mass_g, y = bill_length_mm), color = species) +geom_point(aes(color = species))+geom_smooth(method ="lm", se =FALSE, aes(color = species)) +scale_color_colorblind() +theme_bw() +labs(x ="Body Mass (g)",y ="Flipper Length (mm)",color ="Penguin Species" )